

This incredibly rare, late-season tornado inflicted EF1 damage to farms as it struck the Charleville area. A sharp cold front produced an intense thunderstorm over Eastern Ontario, spawning this tornado north of Prescott. It took down trees, caused minor damage to a few properties and, at one, left a farm silo with significant structural damage. What is perhaps most remarkable about this event is that witnesses report that the storm was producing snow which was falling as the tornado was occurring. According to Sills, Giguère and Henderson (2016), an EF1 tornado with a track length of 270 metres and width of 75 metres was identified.
The Forecast
Figure 1 depicts the surface observations at 11:00 am EDT, which shows a cold front moving through southern Ontario and a weak low pressure system in Quebec.
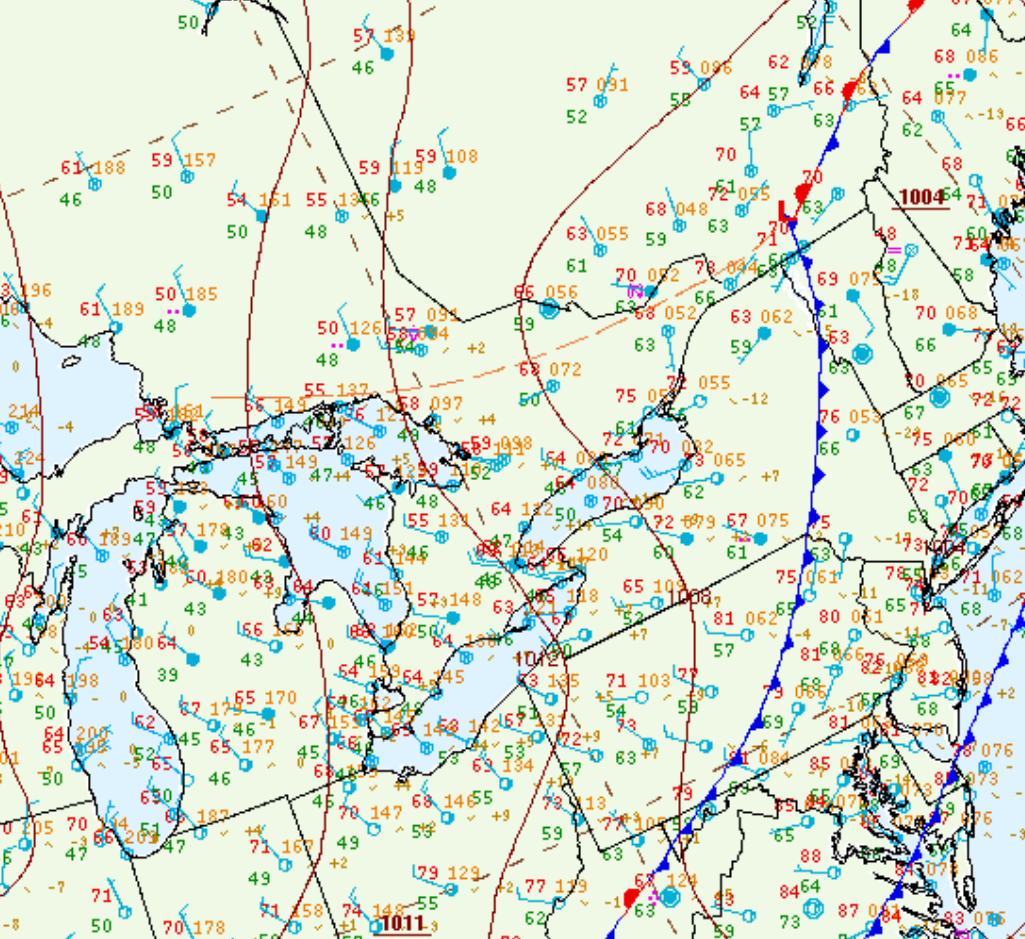
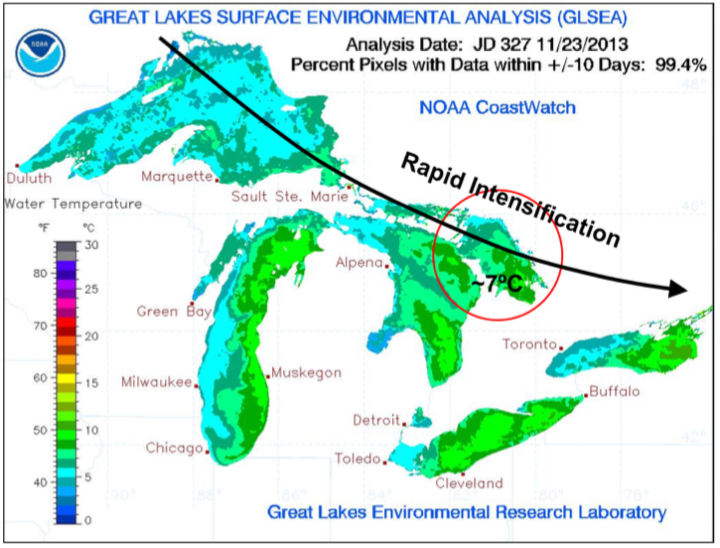
Figure 2 depicts a secondary low pressure system, which rapidly intensified while moving across the warm waters (~7C) of Georgian Bay behind the cold front, which continued to move east-southeast bringing deep convection and moisture around its centre and along the cold front.
According to Sills et al. (2016), stratiform precipitation occurred in the vicinity of the warm front, which is depicted in Figure 3 below. The surface temperatures across eastern Ontario during the tornado was observed to be -6C near the low pressure system, just below 0C ahead of the cold front and near -2C where the tornado occurred (Sills et al., 2016).
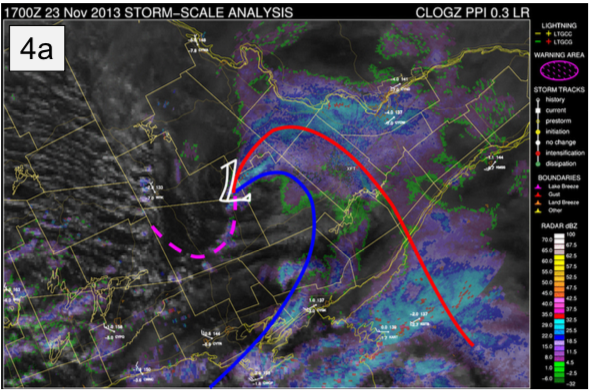
Figure 3. Composite analysis maps showing radar reflectivity, visible satellite imagery and surface observations at 1700 UTC showing a low centre, warm front (red line), cold front (blue line) and trough (dotted magenta line) (Sills et al., 2016).
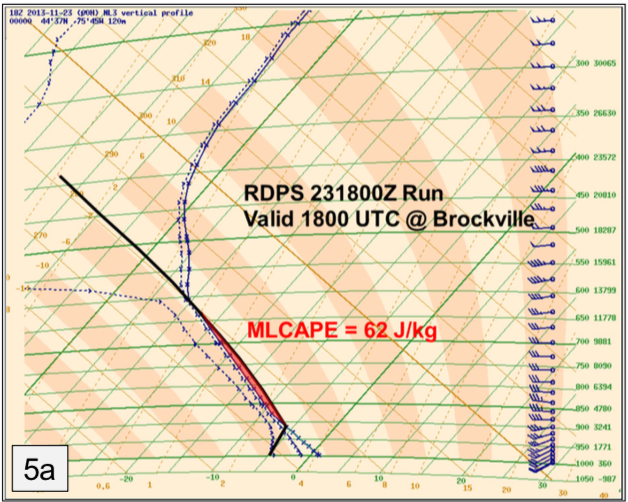
The thermodynamic environment was characterized by ~100 J/kg of MLCAPE (mixed-layer instability), deep-layer shear in the ~20 m/s range and storm relative helicity (SRH) in the ~200m2/s2. A model-derived tephigram near the tornado was developed by Sills et al. (2016) and has been provided in Figure 4 below.
According to Sills et al. (2016), 15 minutes prior to the development of the EF1 tornado, Doppler radar in Franktown, ON detected a weak supercell with a small hook echo region with the echo tops of the supercell at 5 km.
Conclusion
It was then concluded that a low-topped supercell produced a brief EF1 tornado in a below 0C environmental temperatures, which was an event not previously documented (Sills et al., 2016) and that witnesses observed large graupel and whiteout conditions with the tornado, hence the associated term of ‘snownado’.
Sources
Sills, D., Giguère, M. E. & Henderson, J. (2016). A Unique Cold-Season Supercell Produces an EF1 ‘Snownado’. Conference: 28th AMS Conference on Severe Local Storms, At Portland, OR. Research Gate. https://www.researchgate.net/publication/311644883
NWS Weather Prediction Center Surface Analysis Archive. (2017). Surface analysis 15Z Sat Nov 23 2013. Retrieved from: https://www.wpc.ncep.noaa.gov/archives/web_pages/sfc/sfc_archive.php