

The Fargo tornado became a cornerstone of tornado research. A family of five tornadoes were observed from the same parent storm, including an F5 tornado in Fargo, ND. These tornadoes would become the study of Dr. Ted Fujita, which would develop the Fujita scale to classify tornadoes, implemented in 1971 and named in his honour (NWS, 2019). Many historical theories and wording came from the study of these tornadoes.
According to the National Weather Service (NWS) in Grand Forks, ND, Fujita would coin the terms “wall cloud”, “tail cloud” and “collar cloud” (NWS, 2019), which are still in use today. The path of the tornado was 9 miles long, up to 700 feet wide and was part of a “family of tornadoes” (another term coined by Fujita), spreading from Buffalo, ND to Dale, MN (NWS, 2019). According to the NWS (2019), this cyclic supercell lasted six hours and dropped tornadoes for more than four hours. The Air Defense Command military radar site measured thunderstorm tops between 65 000 to 75 000 ft and was a very intense tornadic supercell (NWS, 2019).
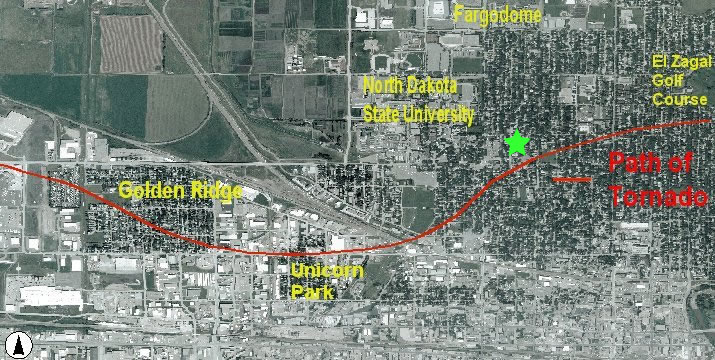
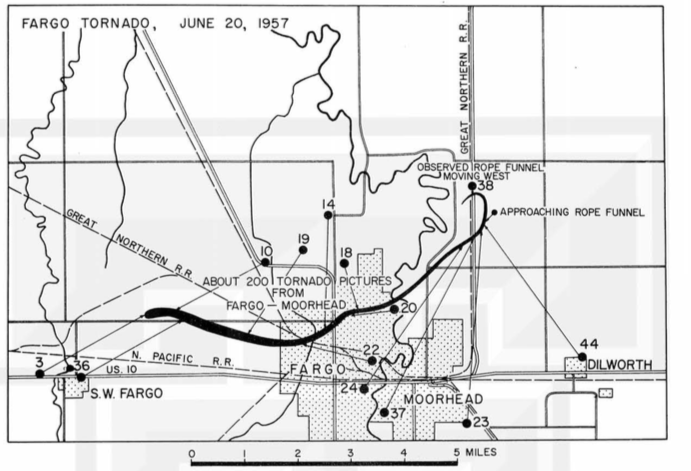
Figure 1 depicts the path of the Fargo tornado. Because it hit a major population center, the Fargo tornado was the most photographed and documented tornado at the time (North Dakota State University, 2014). According to NDSU (2014), this greatly increased our understanding of tornadoes and made Fujita’s study the most detailed tornado study available at the time.
The forecast of June 20, 1957
Morning Analysis (1200 UTC – 6:00 am CST)
Figure 2 depicts an upper-level jet maxima ejecting into the North American continent in the early morning of June 20th. This jet maxima is associated with an upper-level trough, which is observed in Figure 3 over Vancouver Island, BC.
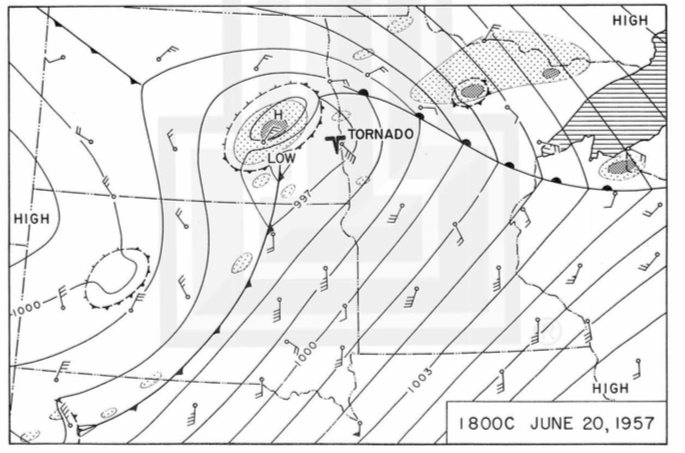
This upper pattern is characterized with southwest flow aloft and moisture advecting into the Northern Plains. At the surface, a surface low pressure was observed near Bismarck, ND at 12:00 pm CST (Figure 4), with its associated fronts.
According to Dr. Ray E. Jensen (2009), a warning meteorologist at the Weather Bureau in Fargo, temperatures on June 20th were around 80F with dew points in the mid-60’s. After starting his shift at 3:00 pm CST and reviewing the latest surface charts, Jensen noticed his local area to be in the warm sector of a “wave cyclone” (low pressure), which was located east of Bismarck. He also noted that the surface charts showed good atmospheric instability for thunderstorms. According to Jensen (2009), the 6:00 am CST upper-level chart (Figure 3), showed light southerly winds advecting rich moisture into the area in the lower levels of the atmosphere and westerly winds aloft were observed.
Afternoon Analysis (0000 UTC – 6:00 pm CST)
At 0000 UTC (around the time of the Fargo tornado), the 500mb chart depicts the upper-level low entering Montana (Figure 5). Of note, the 850mb chart showing moisture pooling in the southeastern part of North Dakota at 0000 UTC (Figure 6).
At 2300 UTC or 5:00 pm CST, surface analysis indicated a warm front intersecting Fargo and extending from the surface low pressure, which was now east of Bismarck (Figure 7). Storms were to develop along the intersection of the cold front and warm front in Southeastern North Dakota, a classic Northern Plains tornado setup (NWS, 2019).
According to Jensen (2009), the review of these latest weather charts convinced him that it was “highly likely” that thunderstorm activity would occur during his shit. Jensen used the 3:00 pm and 4:00 pm (CST) aviation weather reports to plot and analyze the surface charts in hopes to gain clues about the mesoscale environment. Below are some of Jensen’s personal notes about the Fargo tornado as observed from the U.S. Weather Bureau (now NOAA’s National Weather Service) in Fargo.
The Fargo tornado
Before tornado
The observational network at the time (1957) was sparse, but plotting surface maps was no longer needed after 5:00 pm CST because weather observations indicated a line of towering cumulus (TCU) extending west of Fargo to north of Fargo (Jensen, 2009). At 5:08 pm CST, Jensen observed that one of the TCU’s had quickly matured into a cumulonimbus cloud and that a line of thunderstorms could now be viewed from the weather office. At 5:25 pm CST, Jensen observed a tornado, which he estimated to be 25 miles west of the weather office. At 5:46 pm CST, Jensen filed a “special weather observation”, which indicated that a line of thunderstorms was positioned west of Fargo to north of Fargo. His immediate priority was to warn the public of impending danger. At 5:54 pm CST, he noted that the sky above the weather station was obscured by a slowly rotating cumulonimbus cloud, as it proceeded towards Fargo. Jensen notes that not long after this, the Fargo tornado would emerge from said cloud. At 5:20 pm CST, Jensen received a severe thunderstorm and tornado forecast for parts of North Dakota, South Dakota and Minnesota from the SELS Unit in Kansas City, MO. The forecast read “severe thunderstorms and tornado forecast for west central Minnesota and Southeastern North Dakota with possibility of a tornado in West-Central Minnesota and Southeast North Dakota until 11:00pm CST Thursday night…approximate area bounded by 30 miles northwest of Jamestown to 10 miles south of Bemidji to 40 miles southwest of Redwood Falls, Minn. (sic), to 20 miles southeast of Pierre to 20 miles northwest of Jamestown” (Jensen, 2009).
During tornado
Around 5:25 pm CST, Jensen observed a large cone tornado roughly 25 miles just west of the weather station or roughly in the Mapleton area. At this time, Jensen issued a tornado warning bulletin for the Fargo-Moorhead and vicinity, saying a tornado had been sighted and that it was moving eastward (Figure 8). This warning urged residents to begin emergency preparations in the event the tornado would move toward their area. Jensen requested the North Dakota Highway Patrol (NDHP) to monitor the movement of the tornado. Around 5:30 pm CST, the tornado lifted. However, the line of storms was still moving towards Fargo. Around 5:35 pm CST, Jensen became aware of, what would later be called a “collar cloud” and “wall cloud”, features on the eastward moving storm. At 5:40 pm CST, a tornado was reported to have touched down at four different occasions. An emergency broadcast was initiated, warning that a tornado was taking aim at Fargo. At 6:40 pm CST, Jensen notes that “all power and communications were lost at the Weather Bureau”. At 6:28 pm CST, the Fargo tornado emerged from a wall cloud on the southern end of the line of thunderstorms, roughly four miles southwest of the station. Jensen notes that the tornado quickly became wider as it moved toward Fargo (Figure 9). At 6:28 pm CST, the CONELRAD system was initiated, which is when the Weather Bureau directly took over broadcast over all radio/television. The broadcast said that a tornado was approaching Fargo from the west. As the tornado tore through the Golden Ridge residential area, Jensen observed “I could see whole sides of houses being thrown 300-400 feet into the air”. As the tornado was south-southeast of the station, Jensen observed that the tornado changed direction briefly and started heading towards him. This direction shift was brief as the tornado continued its eastward path towards Minnesota. At this time, all power was lost at the weather station.
After tornado
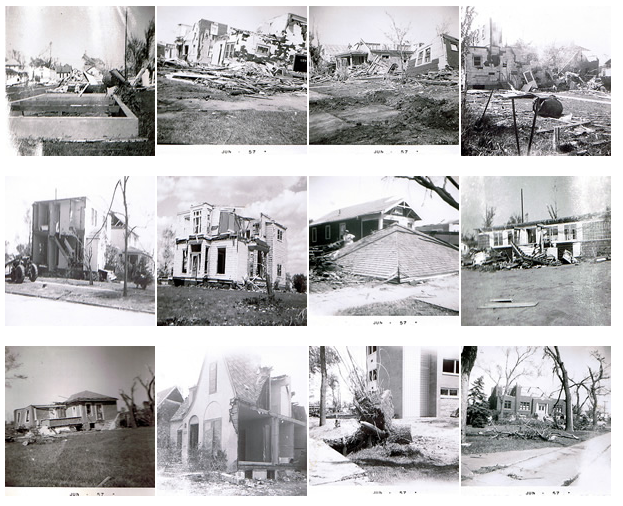
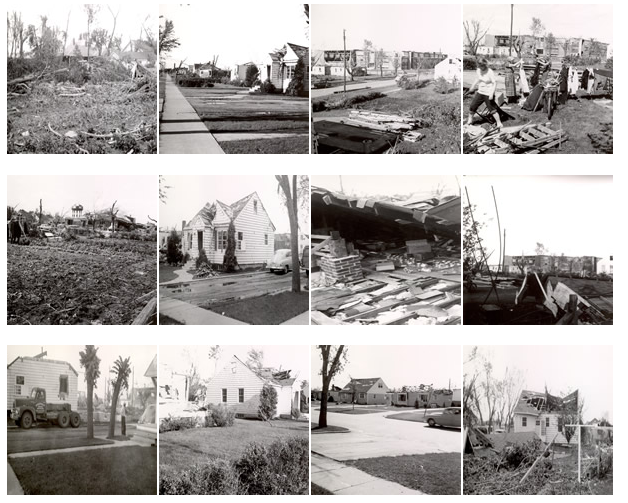
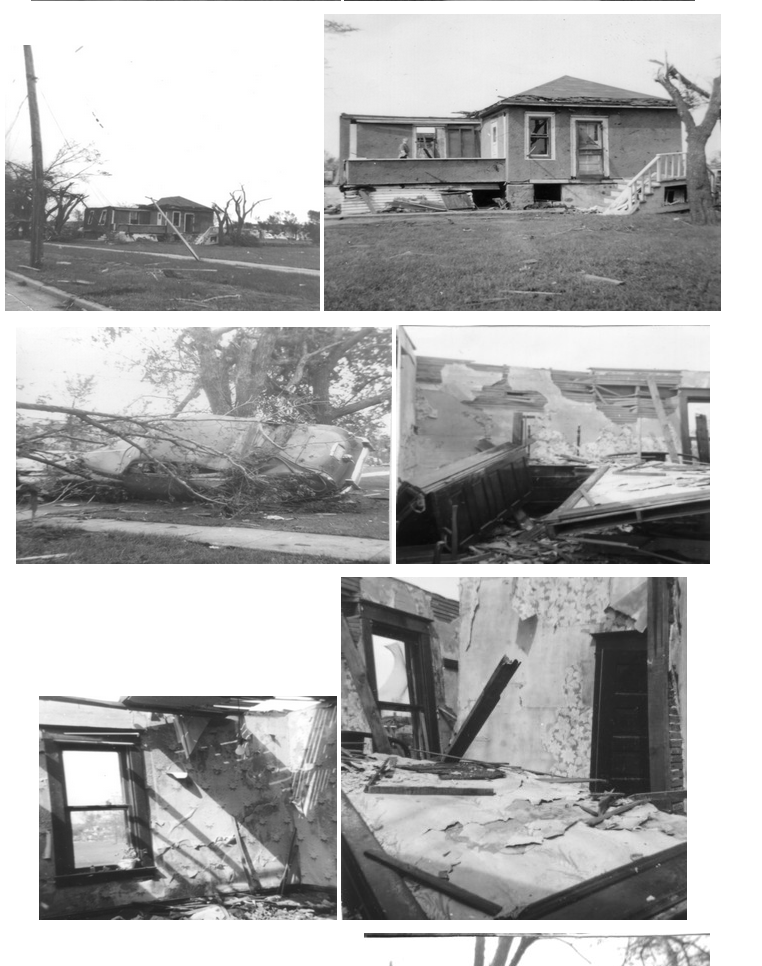
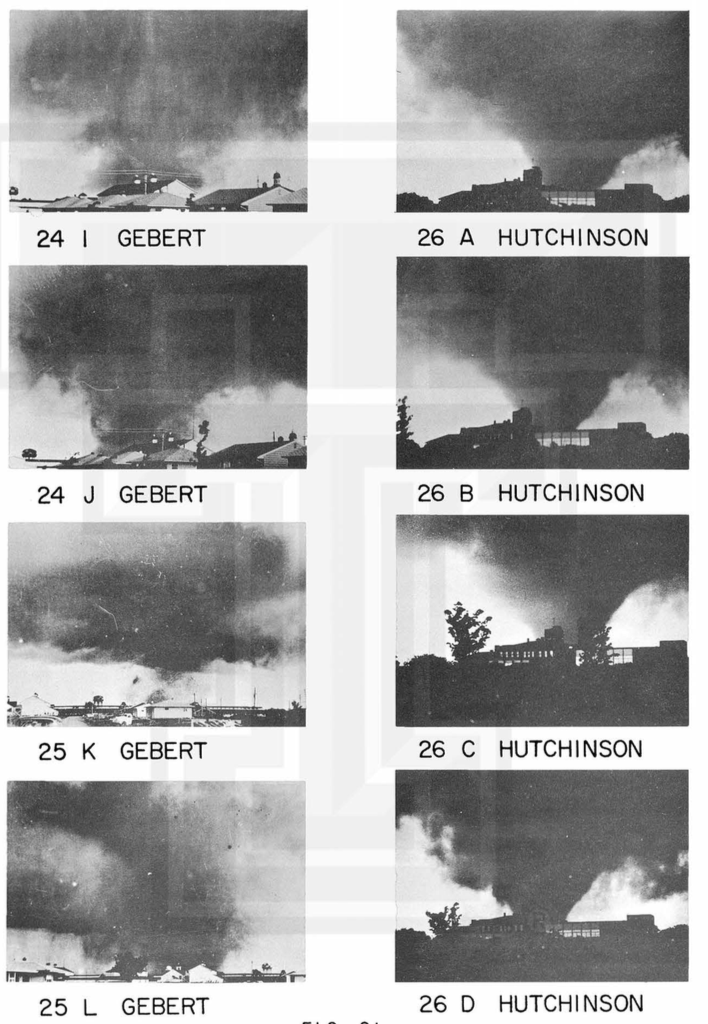
Debris from the Fargo tornado was found 54 miles from Fargo in Detroit Lakes, Minnesota (NWS, 2019). Here is a collection of user-submitted pictures taken from the NWS Grand Forks, ND:
According to NOAA’s storm event database (2019), the Fargo tornado killed 10 people and injured 103. The tornado destroyed over 300 homes and damaged around 1000. The damaged buildings included four churches, three schools and at least 15 commercial buildings (NDSU, 2019). The total estimated damage was over 25 million dollars (without inflation) (NOAA, 2019).
Research done on Fargo tornadoes
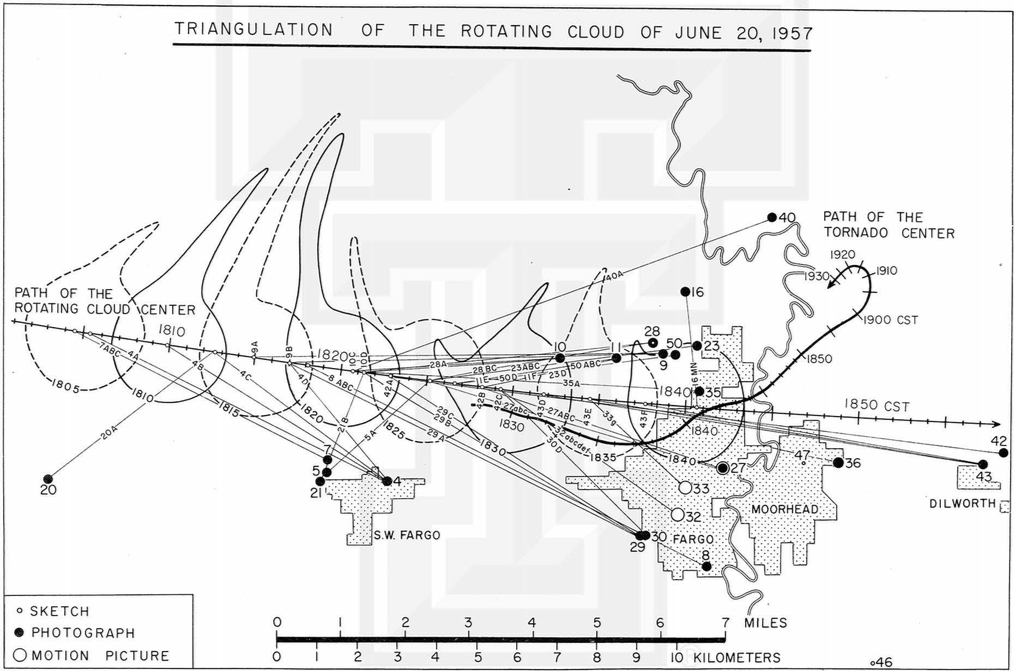
We won’t go through the whole paper/study done by Fujita on these tornadoes, but some key elements are presented here. We encourage you to review his paper provided in the “sources” at the end of this post. Figure 10 depicts Fujita’s surface analysis at 6:00 pm CST and location of the Fargo tornado.
It goes without saying, Fujita did ground breaking research on tornadoes. Fujita was commissioned by the United States Weather Bureau to conduct a physical and meteorological analysis of the Fargo tornado (Jensen, 2009).
Timeline of “family of tornadoes”
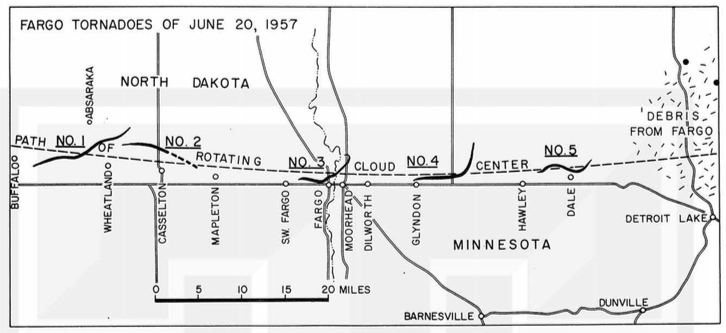
While Fujita was commissioned to document the “Fargo tornado” he ended up documenting a “family of tornadoes” as depicted in Figure 11 and explained below. The path of each tornado is outlined in Fujita’s paper, but we included the Fargo, ND tornado’s path as seen in Figure 9 and the storm’s path as seen in Figure 8.
- Wheatland, ND Tornado: 4:30 pm CST
“This storm, with its path of about 11 miles, was accompanied by a funnel aloft. Throughout the life of the storm the funnel remained narrow and long like a rope or a snake, as described by local observers. No property damage was reported in its path. The storm merely picked up haystacks and dust, causing some damage to crops such as beans” (Fujita, 1959).
- Casselton, ND Tornado:
“This tornado, appearing approximately when the first one disappeared, left a path of five miles in the Casselton Township. The storm in its mature stage was accompanied by a cone-shaped funnel, which probably touched the ground north-northwest of Casselton, then was lifted rapidly. The traceable damage path was five miles, but the system aloft would have drifted at least a few miles toward the East-Southeast” (Fujita, 1959).
- Fargo, ND Tornado:
“This was the third tornado to drop in the rural area some two and a half miles west of the Fargo city limits. The total damage path was nine miles, extending into Minnesota” (Fujita, 1959).
- Glyndon, MN Tornado:
“The storm, appearing in the form of a large cone-shaped funnel, left a damage path of about ten miles in length and two blocks in maximum width. Before it dissipated, the storm resembled a huge rope” (Fujita, 1959).
- Dale, MN Tornado: 8:05 pm CST
“The fifth or last tornado of the Fargo tornado family left a surface damage path of as much as seven miles in Highland Grove Township, Minnesota. It began, as commonly seen in the other cases, in the shape of a cone funnel and ended in the form of a rope” (Fujita, 1959).
Additional information
Collection of personal accounts of the Fargo, ND F5 tornado: https://www.weather.gov/fgf/fargo57tornado_comments
Chronological timeline of weather observations and warning process at the Weather Bureau in Fargo, ND here: https://www.weather.gov/media/fgf/misc/Jensen_Fargo_Warning_Paper_11_19_09.pdf
Sources
National Weather Service (2019). NWS Grand Forks, ND: Fargo 1957 F5 Tornado. Retrieved from: https://www.weather.gov/fgf/fargo57tornado
North Dakota State University (2014). The Fargo Tornado of June 20, 1957. Retrieved from: https://www.ndsu.edu/ndscoblog/?p=521
R. E. Jensen (2009). Fargo, North Dakota F5 Tornado June 20, 1957. How the Public was Warned: A Personal Account.
T. Fujita (1959). A Detailed Analysis of the Fargo Tornadoes of June 20, 1957. University of Chicago.
NOAA National Centers for Environmental Information (2019). Storm Events Database. Retrieved from: https://www.ncdc.noaa.gov/stormevents/eventdetails.jsp?id=10087403
North Dakota State University Libraries (2019). 1957 Tornado. Retrieved from: https://library.ndsu.edu/fargo-history/?q=content/1957-tornado