

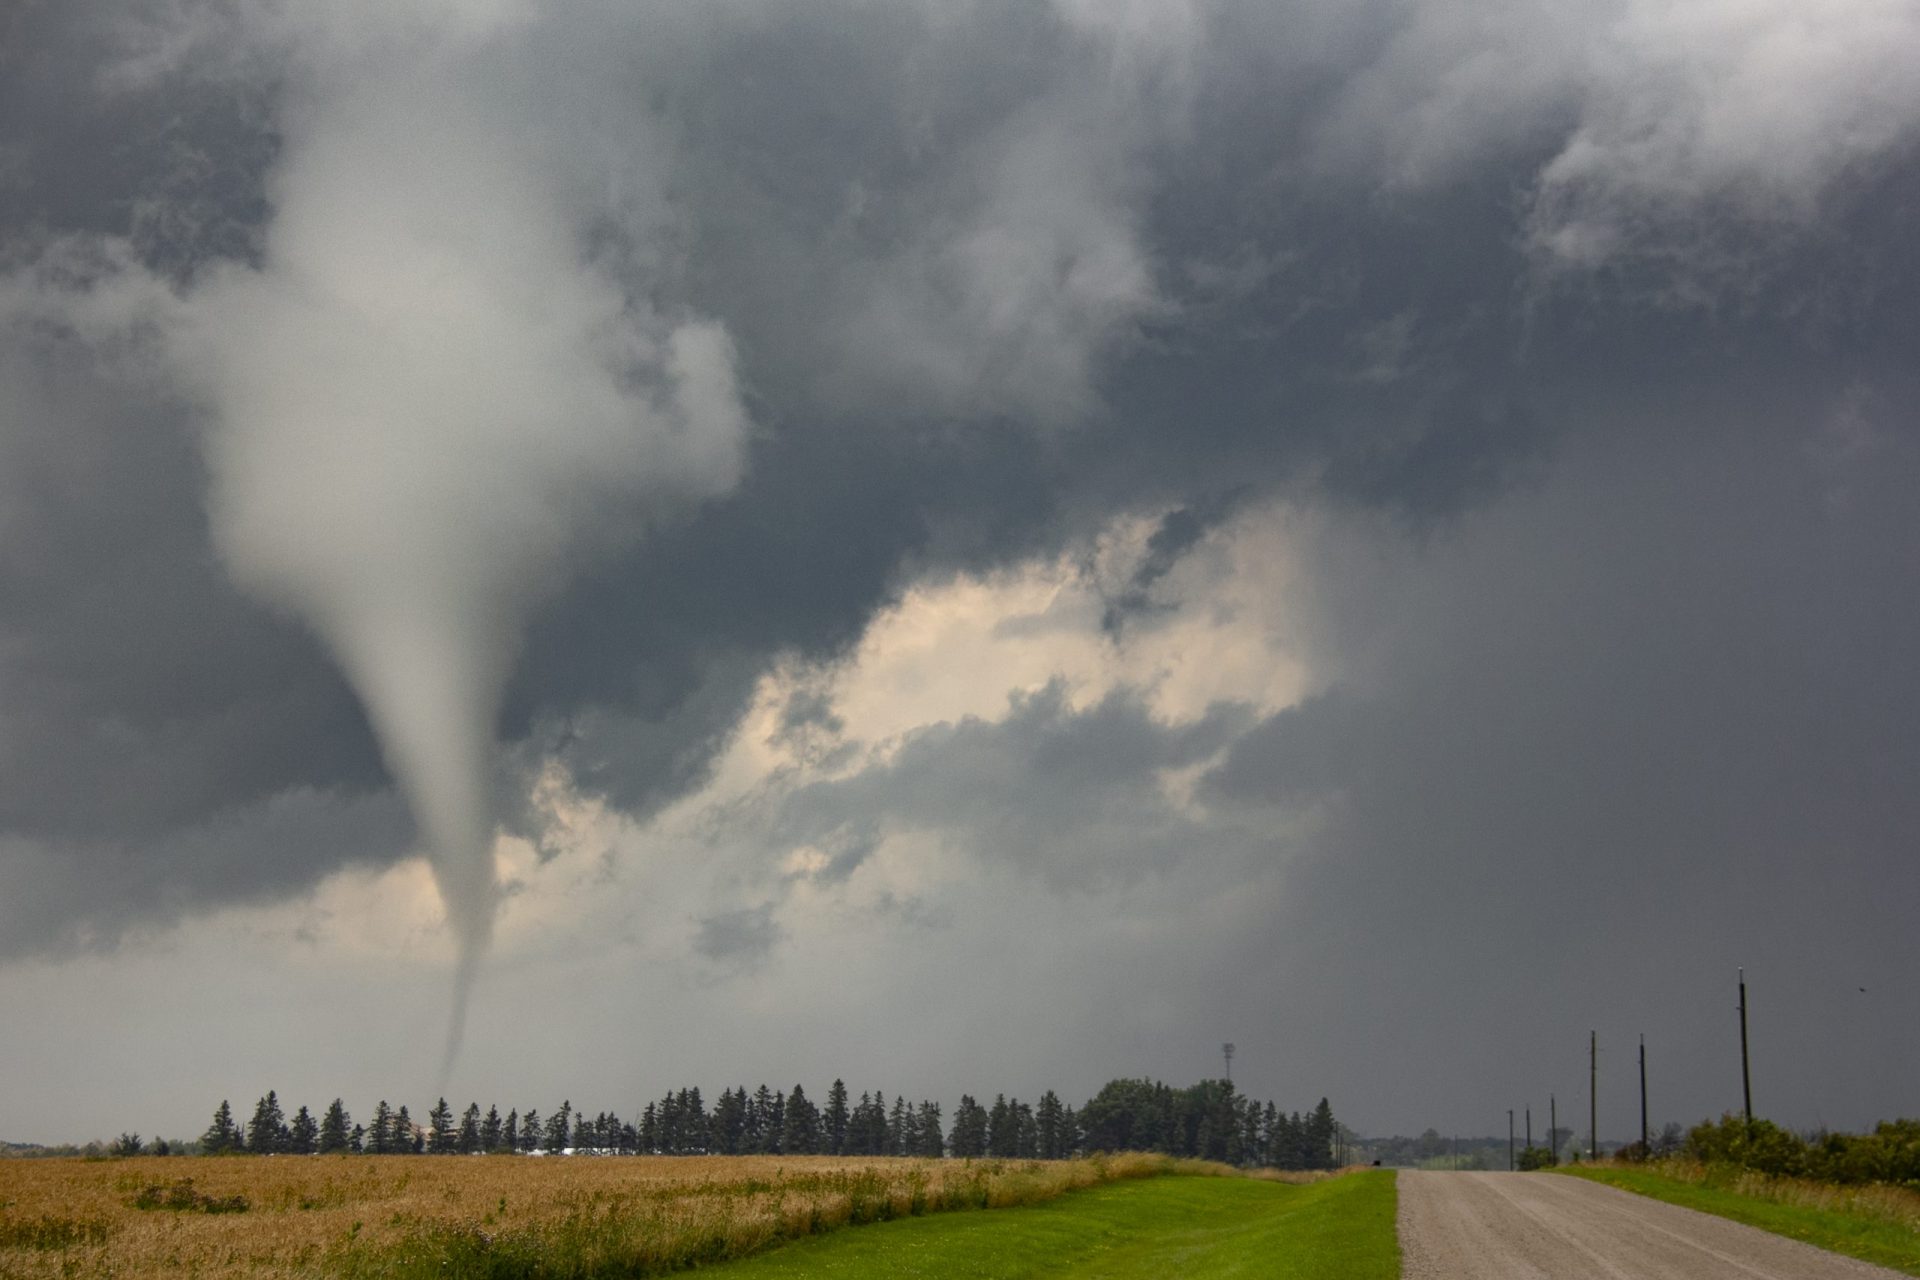
This tornado was incredibly photogenic; it was reported, photographed and filmed by a number of CANWARN spotters and storm chasers including this author, Travis Farncombe, as well as Dave Patrick and David Chapman. It travelled along Highway 109 on a path around 9 km long and 100 metres wide, developing just east of Arthur and dissipating just west of Grand Valley. The towns narrowly escaped disaster as it passed between them without inflicting any major damage.
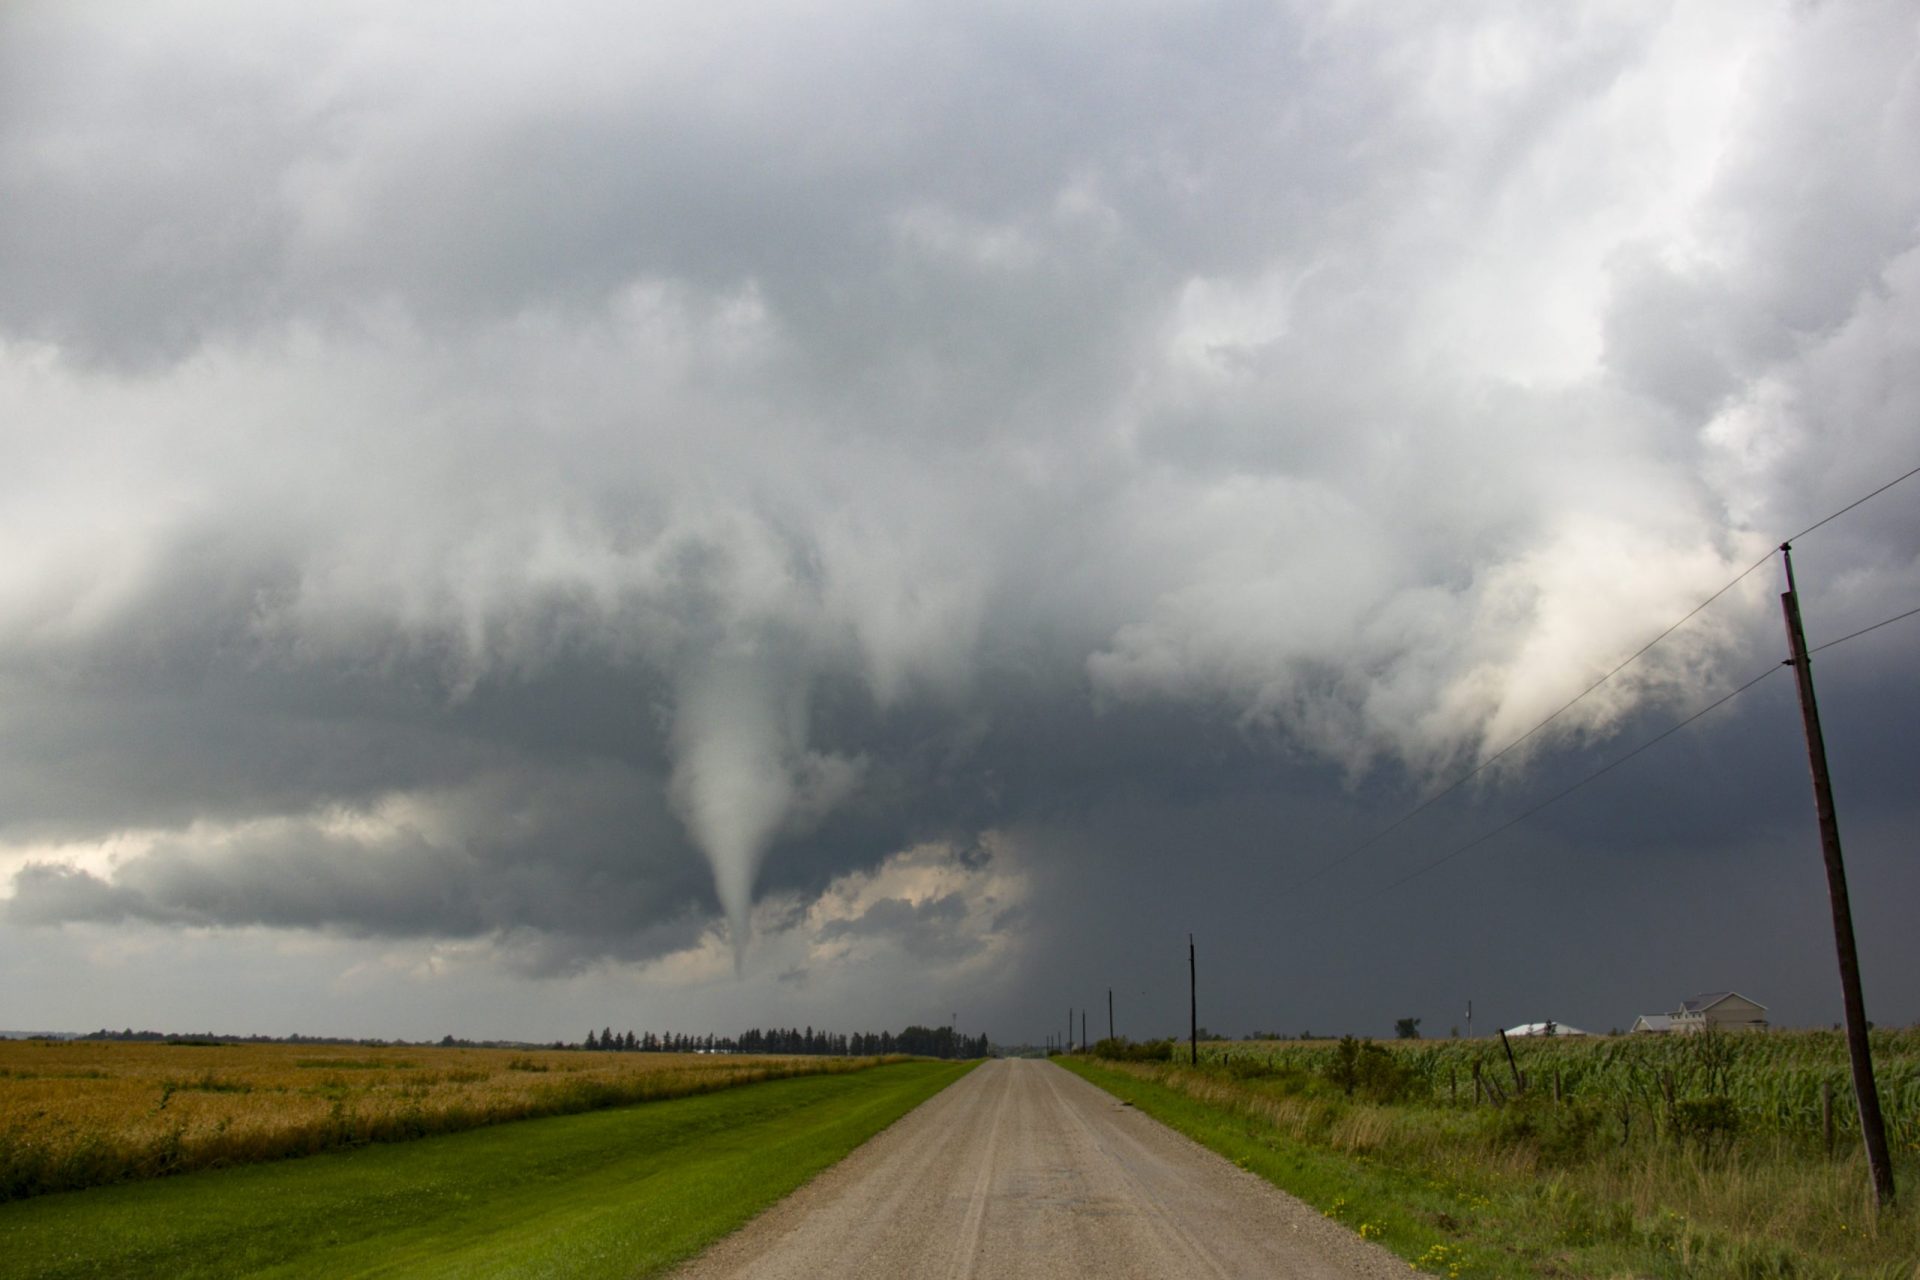
It formed as a swirl of dust and debris beneath a rapidly rotating wall cloud with low-hanging fingers, then lifted briefly before coming back to the ground to stay. It condensed downward, narrow and dart-like, then became more serpentine as it undulated and headed to the east.
During its mature stage, the tornado intensified, becoming a drill bit with intense, rapid rotation at its base as it tore a tree from the ground and lofted it hundreds of metres into the air. As the tornado neared the end of its life, it became a tapered cone with a plume of dusty debris at its base, then roped out before reaching the village of Grand Valley. It had been on the ground for close to twenty minutes.
The tornado received a low rating since it spend most of its time over open fields, damaging only a few trees and levelling a swath of corn. However, it is likely that this tornado was capable of much stronger EF2 or EF3 damage had it impacted either of the towns that tracked between.
This was one of five tornadoes that touched down on August 7, 2013. The others:
- Orillia (EF0)
- Carnarvon (EF1)
- West Guilford (EF1)
- Head Lake (EF0)
The Forecast
Figure 1 depicts the surface observations at 5:00 pm EDT, which shows a cold front moving across the Great Lakes, a low pressure over northern Ontario and a warm front across southern Quebec. The cold front likely triggered pre-frontal storms across southern Ontario, one of which developed near Arthur in the late afternoon hours of August 7th.
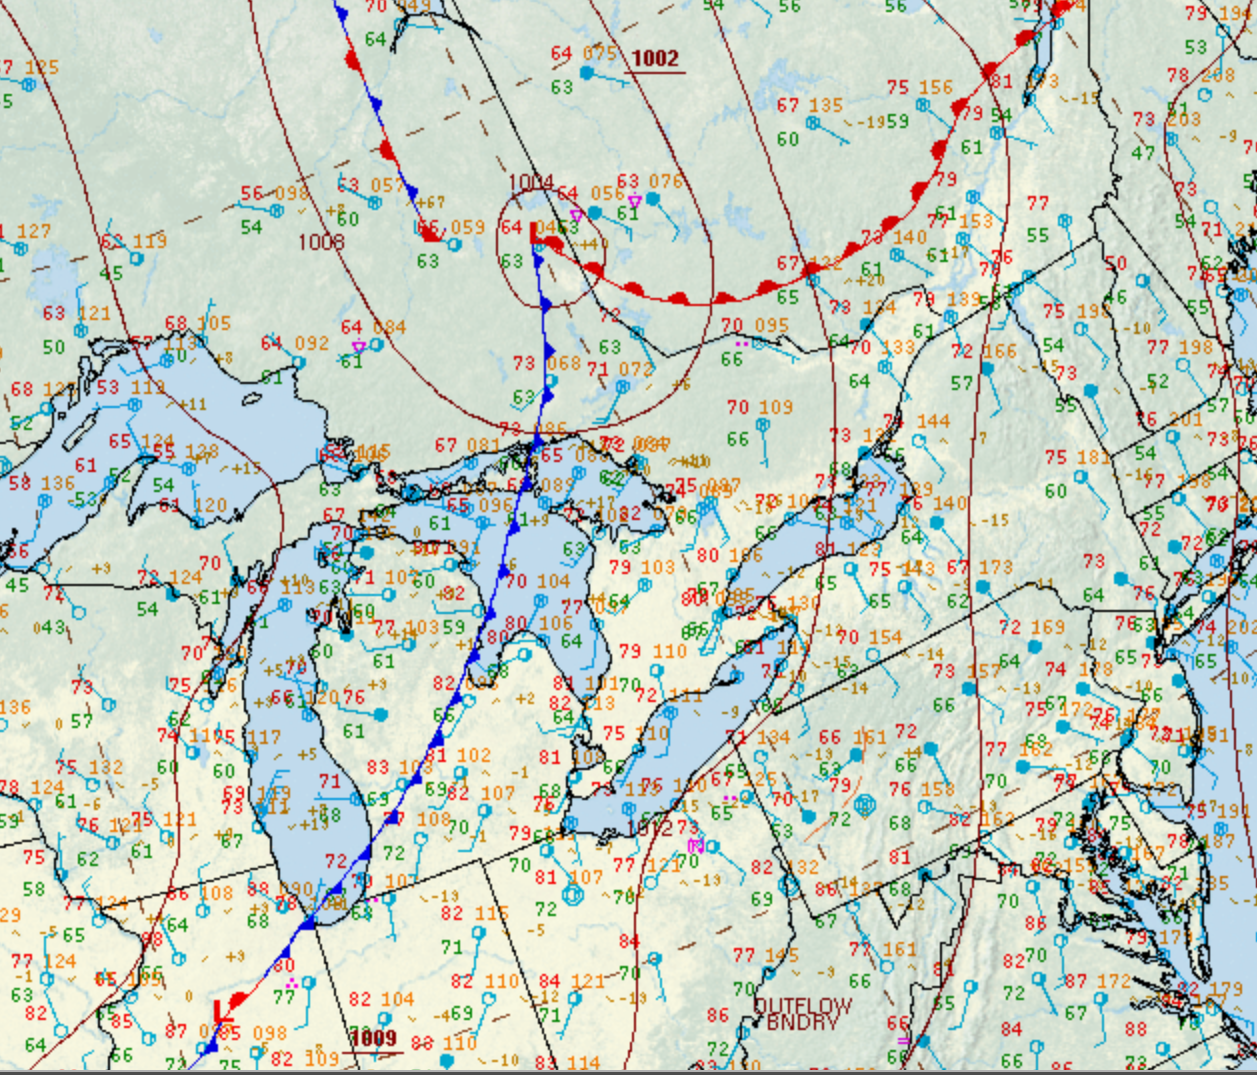
Figure 2 depicts the Doppler radar reflectivity around 6:00 pm EDT, which shows a storm northwest of Brampton. This storm was responsible for the EF0 tornado that occurred between Arthur and Grand Valley.
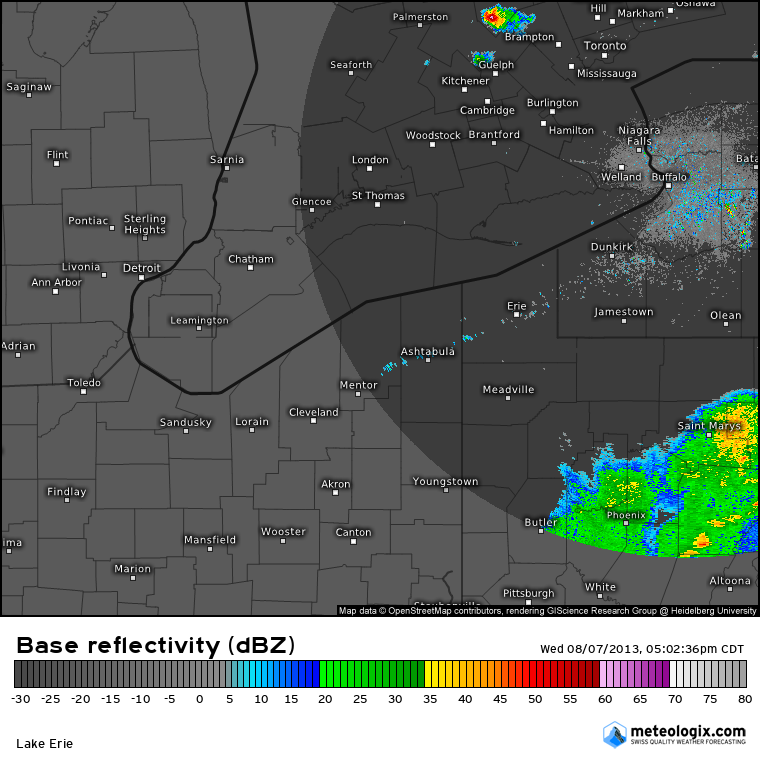
Figure 3 depicts a forecast sounding from the North American Mesoscale (NAM) model at 5:00 pm EDT for Waterloo, which is around 45 minutes due south of Arthur. Figure 3 shows a classic inverted-V profile at the surface with 7.8 C/km lapse rates from the SFC-3 km. Notice the LCL height around 1 km, which would explain why the Arthur tornado was so high-based.
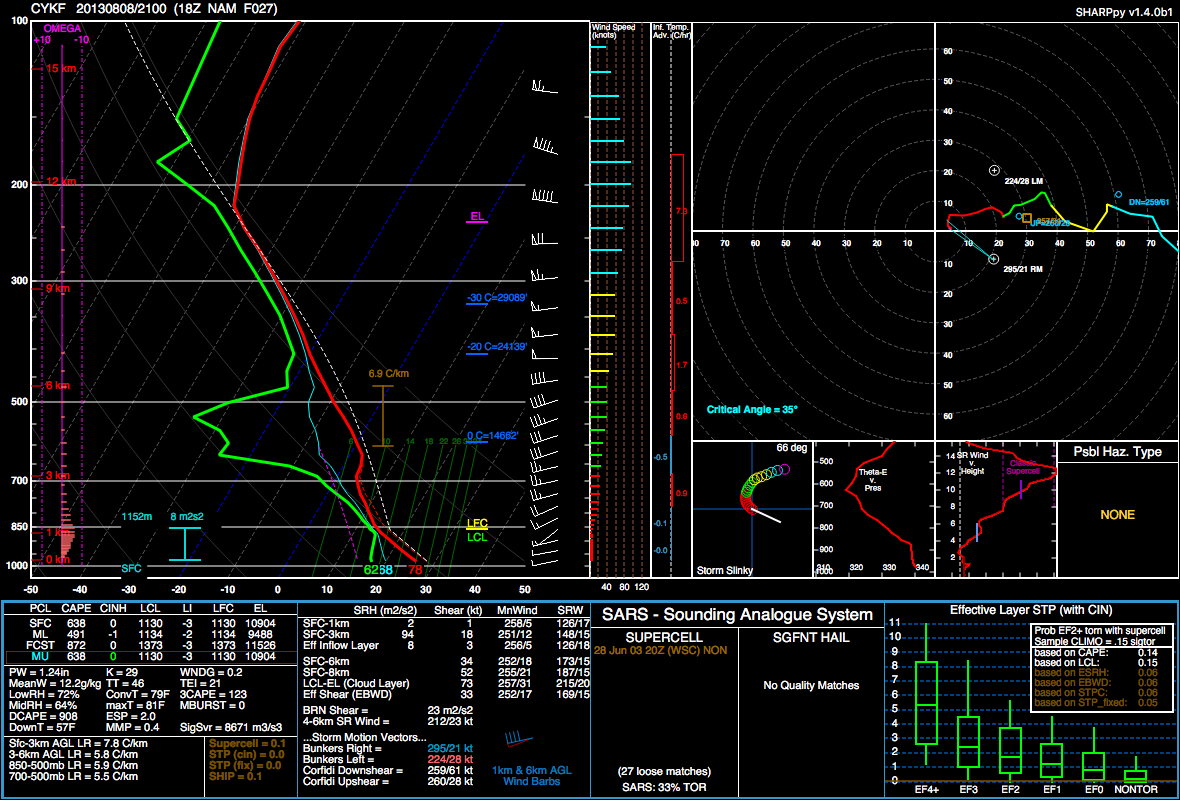
The Arthur tornado was reported to have occurred around 5:30 pm EDT in an environment just north of Figure 3, which makes this tornado an interesting case study due to its high-based and generally ‘dry’ nature, which is unusual for Ontario.
Sources
NWS Weather Prediction Center Surface Analysis Archive. (2017). Surface analysis 21Z Wed Aug 7 2013. Retrieved from: https://www.wpc.ncep.noaa.gov/archives/web_pages/sfc/sfc_archive.php