

According to the National Weather Service in Cleveland, OH (2019), by early afternoon of May 31, 1985, thunderstorms developed in Ontario, Canada just ahead of the cold front. Over a dozen tornadoes occurred in Ontario, with at least four F3s and two F4s reported. However, as the afternoon progressed, the thunderstorm activity developed south into northern Ohio. The initial thunderstorms in the state occurred between 3:00 pm and 4:00 pm EDT near Cleveland. At 4:10 pm, the NWS Office in Cleveland issued the first severe thunderstorm warning of the day for Ashtabula County. From that point on through the evening, weather conditions worsened. As the first reports of damage trickled in to the NWS offices in the area, it quickly became clear that a tornado outbreak of an unprecedented magnitude was taking place across the region. By the end of the evening, a total of forty-one tornadoes had occurred in the United States and Canada. Twenty-one tornadoes tracked across Northeast Ohio and Northwest Pennsylvania during the evening of May 31st. According to Ferguson, Ostby & Leftwich (1987), there were 94 fatalities in 1985 related to tornadoes and 76 of those fatalities occurred on May 31st. This is the story behind this historic tornado outbreak.
The Forecast
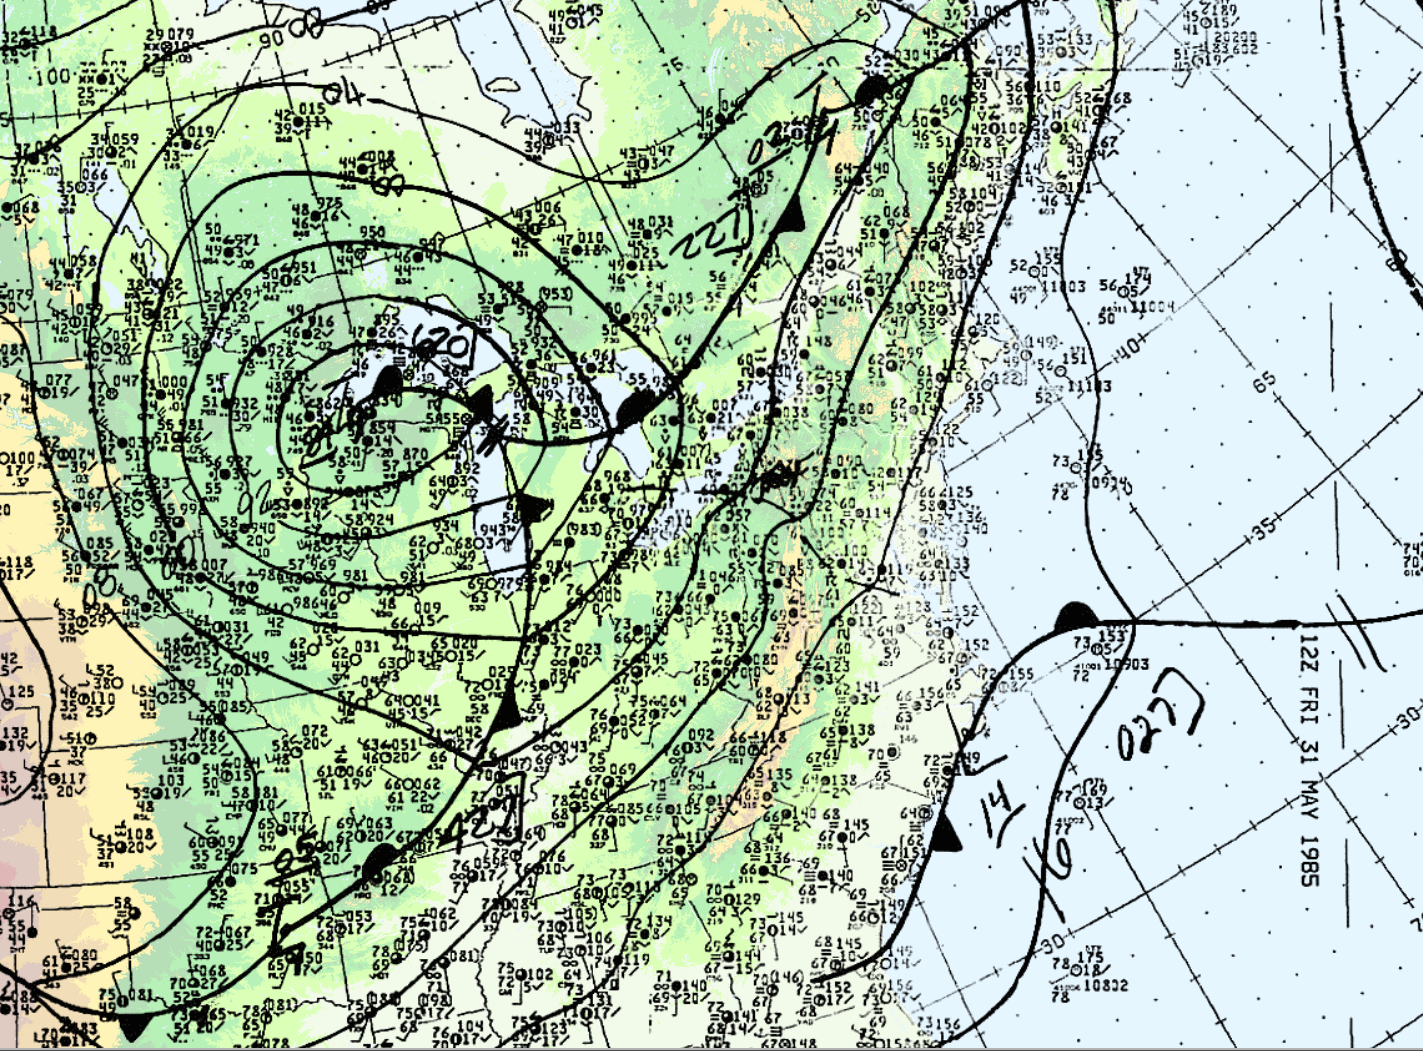
Figure 2 depicts the surface analysis on the morning of May 31st. In Figure 2, we can see a warm front advecting northward across Ontario and a cold front moving eastward (entering Michigan). The cold front would later provide the trigger for explosive supercell thunderstorm development. According to the National Weather Service in Cleveland, OH (2019), the upper air features from the the morning analysis gave classic indications of a significant severe weather event across eastern Ohio and western Pennsylvania. At 850 mb (Figure 3), very warm/moist air was surging north into the Ohio Valley and a dryline was observed over the western Great Lakes and Midwest.
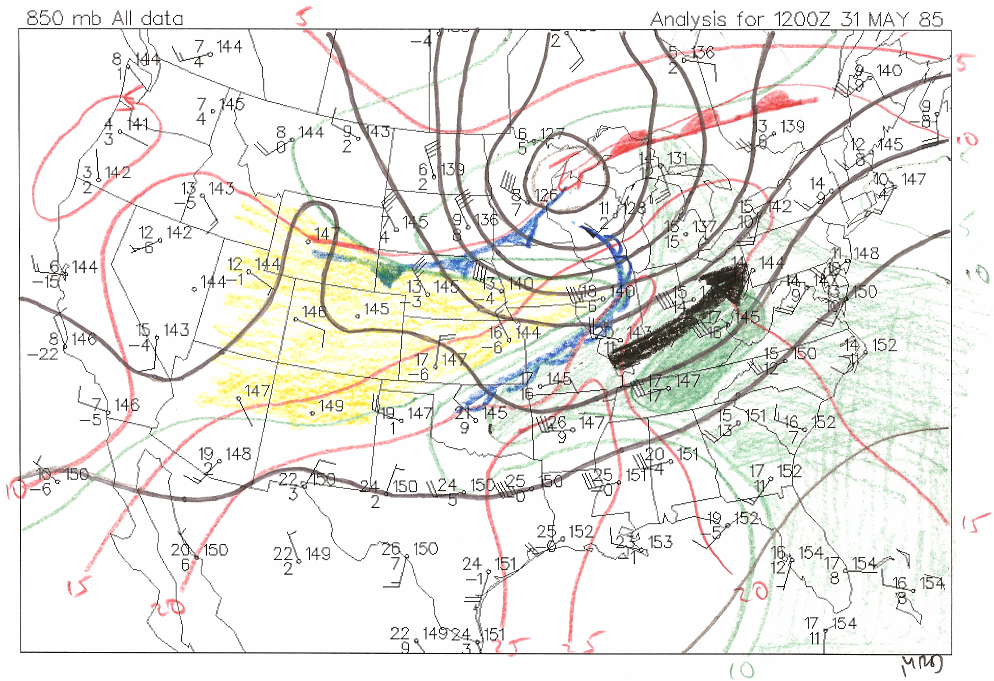
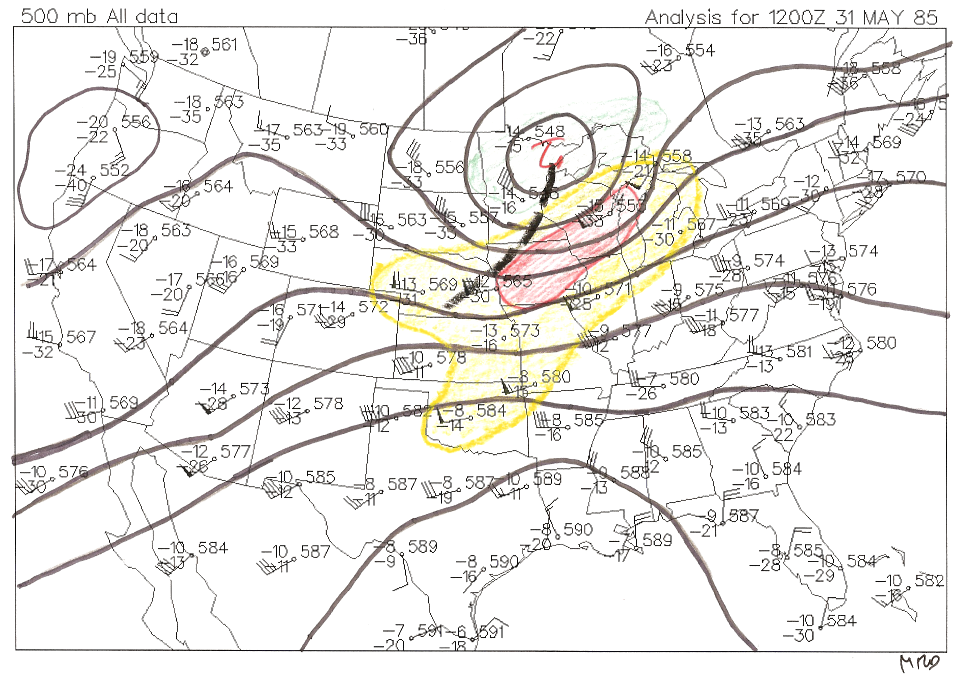
At 500 mb, a negatively tilted trough was positioned over the Midwest (Figure 3) with strong westerly winds in excess of 80 knots directly in front of the trough. The combination of strong westerlies aloft and strong southwesterly jet at 850 mb (Figure 3) allowed for increased vorticity over eastern Ohio and western Pennsylvania (NWS, 2019).
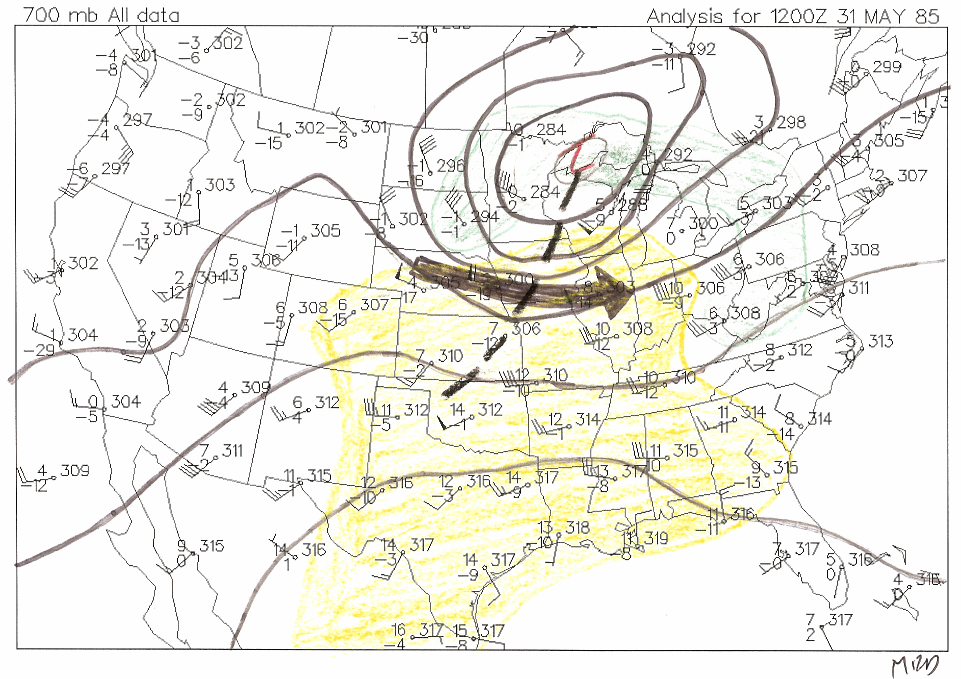
The main severe weather feature that was unusual is seen in Figure 5 on the 700 mb chart. The trough is shown with dry air aloft or “cap”. According to the NWS Cleveland, OH (2019), this is a classic signature of severe weather outbreaks for this region. This warm air aloft allowed surface temperatures to climb in the 80’s for the forecast area.
At the surface, an elevated mixed-layer (EML) with nearly adiabatic lapse rates (~13C/km) between 750 mb and 550 mb was noted (Figure 6). According to the NWS Cleveland, OH (2019), research has shown that this signature on a Skew-T is a good indicator of significant severe weather.
The sounding of Figure 6 shows a small capping inversion near the surface and an inversion from roughly 850 mb to 550 mb. Convective available potential energy (CAPE) at 1257 J/kg, helicity at 355 m2/s2 (which is favorable for the development of mid-level rotation) and energy helicity index (EHI) at 3.1. This sounding is quite impressive for a late-May morning and quite favorable for tornadoes.
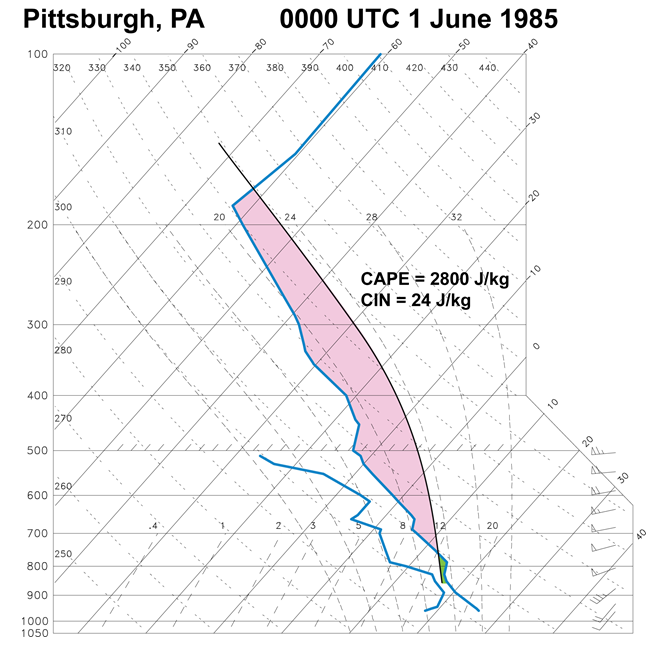
Figure 7 depicts a modified sounding depicting the CAPE at Pittsburgh, PA at 7:00 pm. This depicts 2800 J/kg of CAPE in the vicinity, therefore indicating a moderate to high value of instability in the atmosphere for severe thunderstorms.
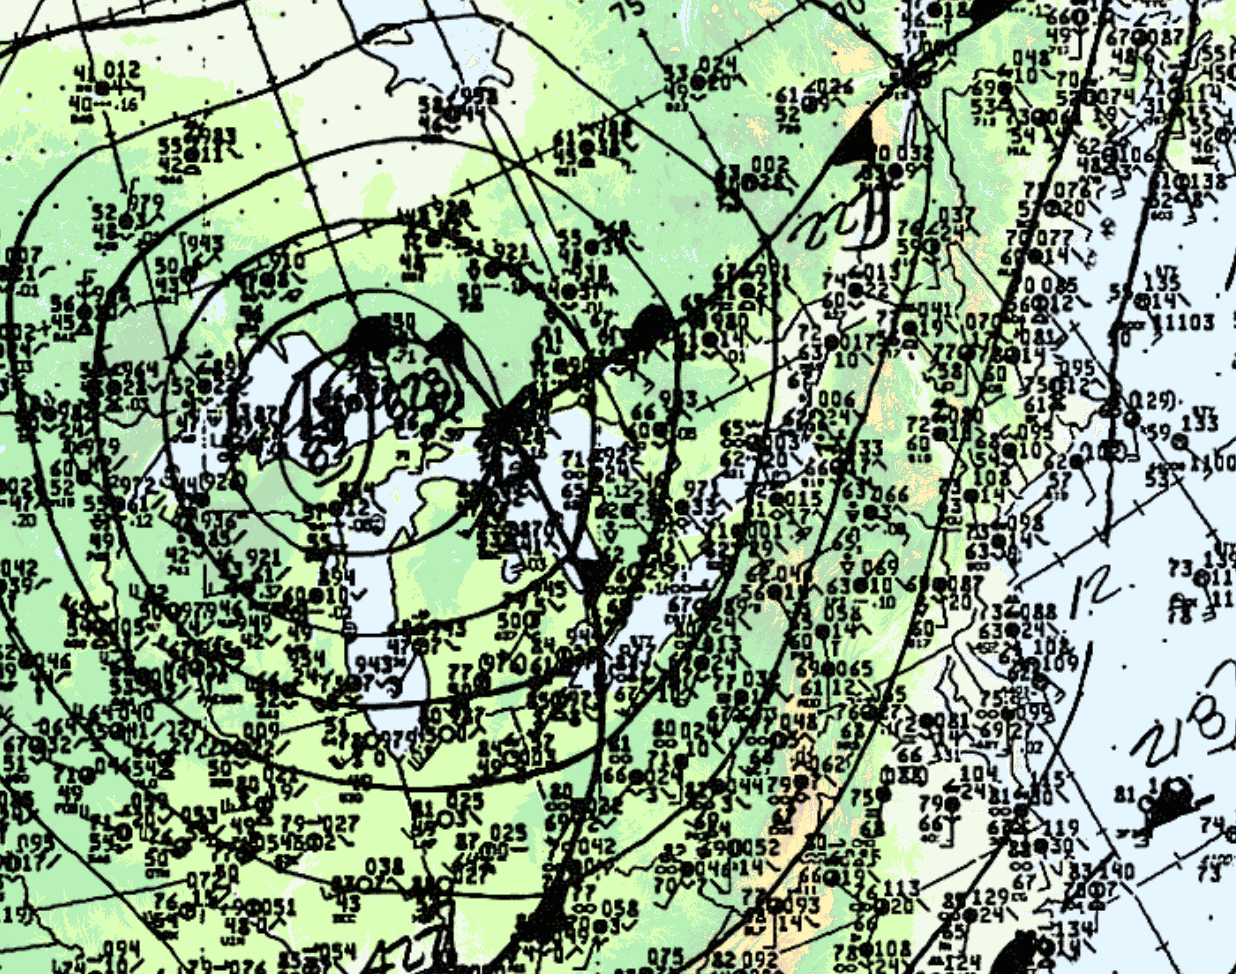
At 18Z (2:00 pm EDT), the cold front was entering Ontario (Figure 8). According to Leduc, et al. (1986), an unseasonably strong low pressure center tracked across upper Michigan during the morning hours to just north of Sudbury by evening. The visible satellite loop in Figure 9 shows the development and explosive growth of thunderstorms across southern Ontario, Ohio, western Pennsylvania and western New York on the afternoon of May 31st.
At 21Z (5:00 pm EDT), the cold front was in western Ontario (Figure 10).
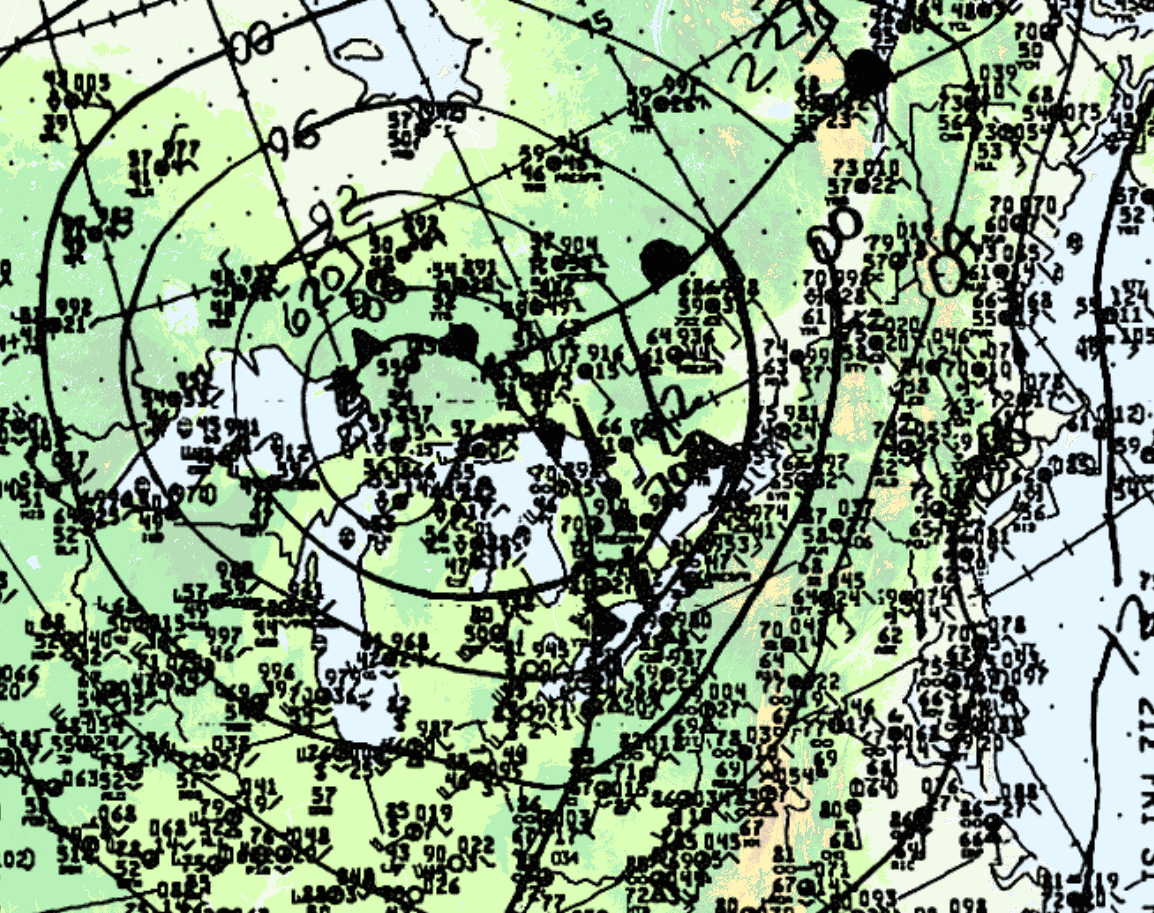
Leduc et al. (1986) notes that the dynamics in place were strong since a sharp cold front (Figure 2, 3, 8 and 10) and an upper trough (Figure 4 and 5) was crossing Michigan, bringing with it strong westerlies in the upper-levels of the atmosphere.
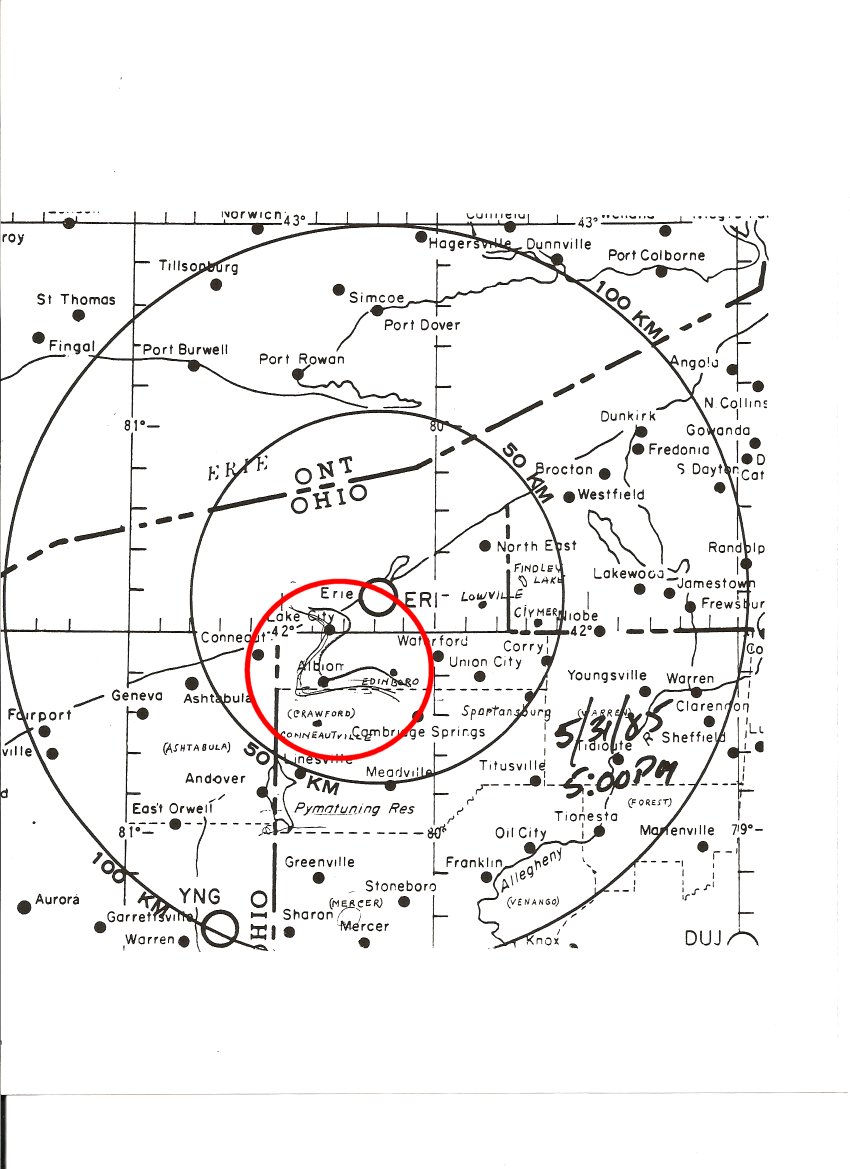
Please note that Figure 11 and the following figures do not depict actual radar observations, but rather hand-drawn depictions of the supercells by NWS meteorologists. According to the NWS Cleveland, OH (2019), before the NWS WSR 88-Doppler Radar, radar operators hand drew the radar echos on overlay maps. Below is a timeline of actual National Weather Service text from northwest Pennsylvania on May 31st:
5:13 pm EDT – Tornado Warning
BULLETIN ACTIVATE EBS
TORNADO WARNING
NATIONAL WEATHER SERVICE ERIE PA
513 PM EDT FRI MAY 31 1985 EXPIRES 530 PM
COUNTIES AFFECTED PA ERIE
THE
NATIONAL WEATHER SERVICE IN ERIE HAS ISSUED A TORNADO WARNING UNTIL
530 PM FOR THESE COUNTIES IN NORTHWESTERN PENNSYLVANIA…SOUTHERN ERIE
A
TORNADO WAS SIGHTED BY STATE POLICE NEAR PENNSIDE…SOUTH OF ALBION IN
ERIE COUNTY AT 505 PM…MOVING TOWARD THE NORTHEAST AT 30 MILES AN HOUR.
5:45 pm EDT – Tornado Warning
BULLETIN ACTIVATE EBS
TORNADO WARNING
NATIONAL WEATHER SERVICE ERIE PA
545 PM EDT FRI MAY 31 1985 EXPIRES 630 PM MAY 31 1985
COUNTIES AFFECTED PA ERIE AND CRAWFORD
THE
NATIONAL WEATHER SERVICE IN ERIE HAS ISSUED A TORNADO WARNING UNTIL 630
PM FOR THESE COUNTIES IN NORTHWESTERN PENNSYLVANIA ERIE AND CRAWFORD.
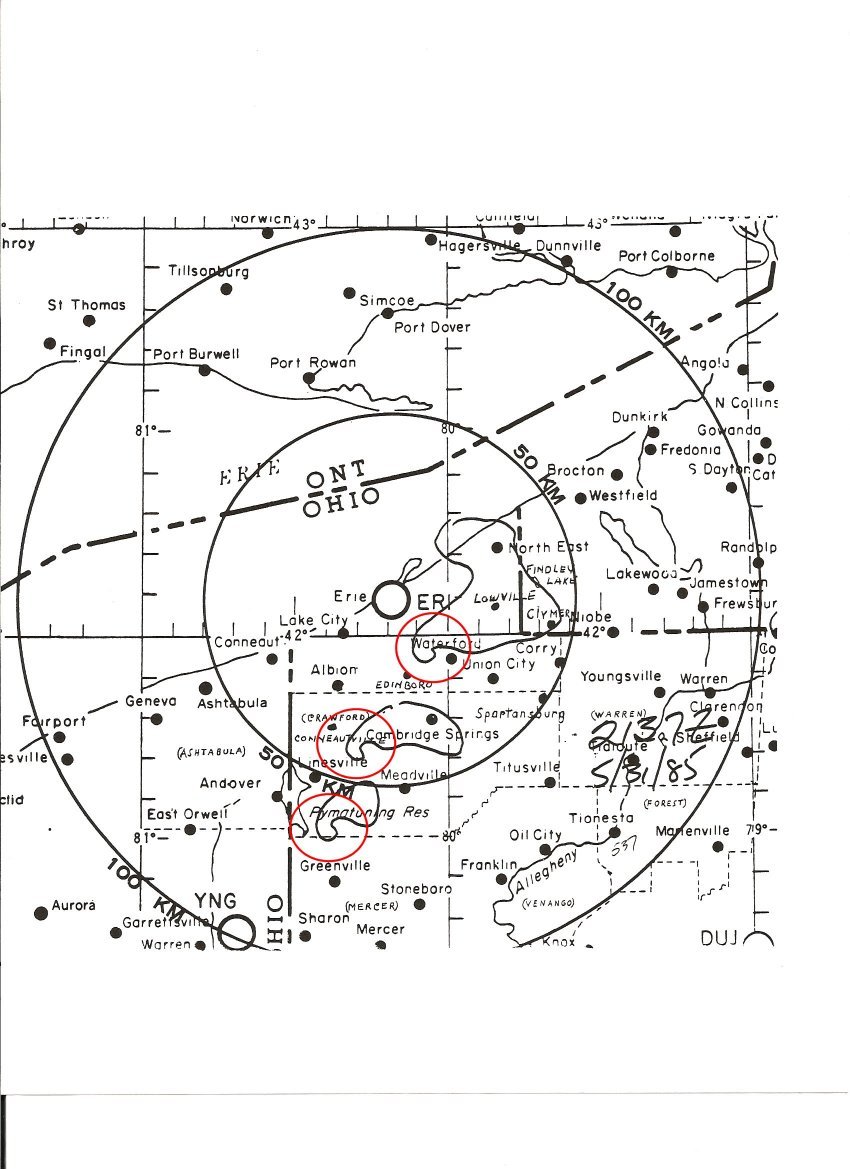
ERIE RADAR SHOWS 3 TORNADOS ON THE GROUND ONE NORTHEAST
OF WATERFORD ANOTHER NEAR CAMBRIDGE SPRINGS AND ANOTHER SOUTHWEST OF
MEADVILLE. THEY ARE ALL MOVING TO THE NORTHEAST AT NEAR 35 MPH.
6:20 pm EDT – Tornado Warning
BULLETIN ACTIVATE EBS
TORNADO WARNING
NATIONAL WEATHER SERVICE ERIE PA
620 PM EDT FRI MAY 31 1985 EXPIRES 700 PM MAY 31 1985
COUNTIES AFFECTED PA ERIE AND CRAWFORD
THE
NATIONAL WEATHER SERVICE IN ERIE HAS ISSUED A TORNADO WARNING UNTIL
700 PM FOR THESE COUNTIES IN NORTHWESTERN PENNSYLVANIA SOUTHERN ERIE
AND NORTHERN CRAWFORD.
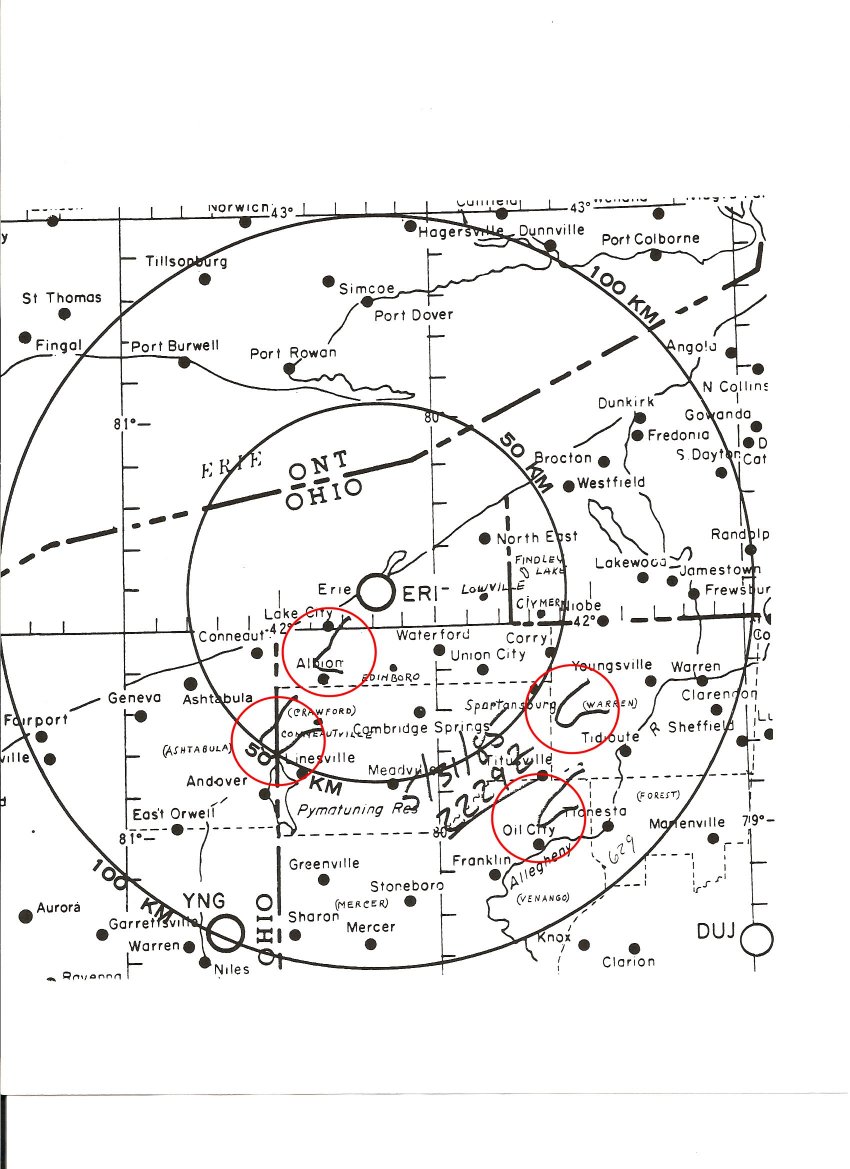
AT 620 PM ERIE WEATHER RADAR SHOWS NEW TORNADOS ON THE GROUND WEST OF ALBION AND CONNEAUTVILLE PENNA. MOVING
TOWARDS THE EAST AT 35 MPH. ANOTHER TORNADO SOUTH OF SPARTANSBURG
MOVING INTO WARREN COUNTY AND ONE NORTH OF OIL CITY MOVING INTO
NORTHERN FOREST COUNTY.
Aftermath
By the end of the evening, a total of forty-one tornadoes had occurred in the United States and Canada. Twenty-one tornadoes tracked across Northeast Ohio and Northwest Pennsylvania during the evening of May 31st. Of these twenty-one, one was rated an F5, and six were rated F4’s. Tragically, these tornadoes killed 66 people in Ohio and Pennsylvania. This day remains the deadliest tornado outbreak ever documented in Pennsylvania. In Ohio, this was the worst event since the April 3-4th, 1974 outbreak that killed 37 in Xenia (NWS, 2019).

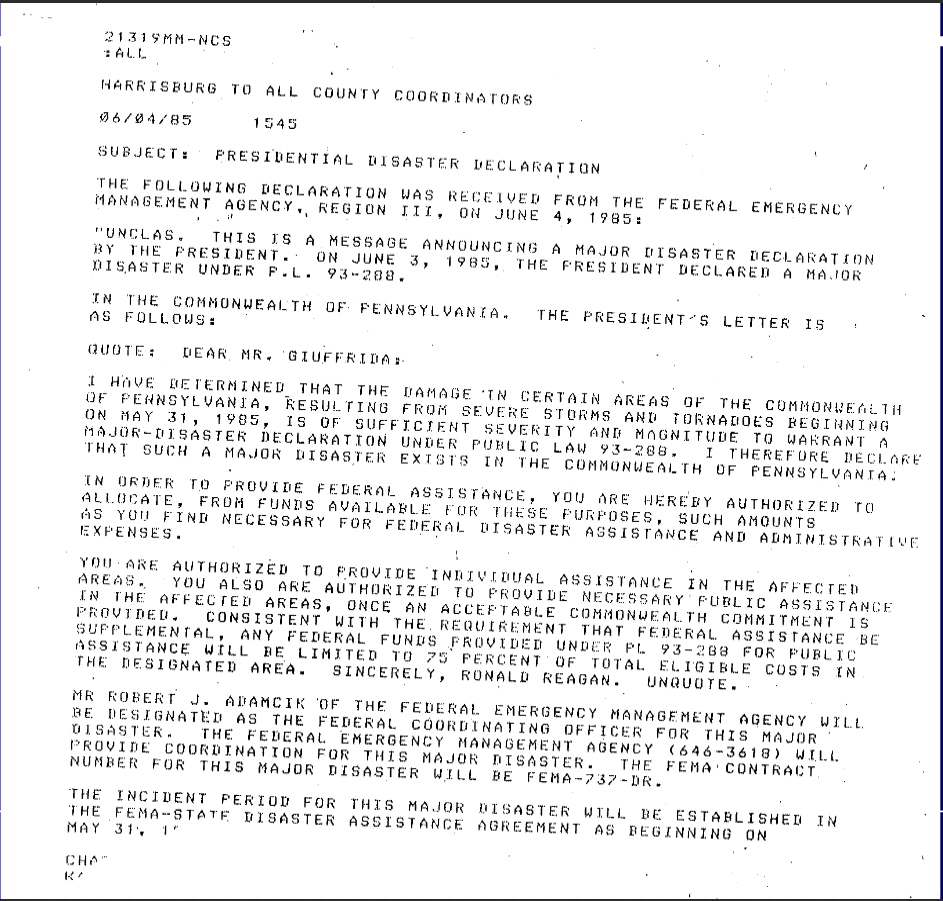
According to Sleptzoff & Dunkle (2009), on June 1st, the Governor of Pennsylvania asked for federal relief to help with the damage left by the May 31st tornado outbreak. On June 3rd, the Federal Government declared a state of emergency for the state of Pennsylvania.
Recap
In total, the Emlenton, PA F0 tornado of May 31, 1985 impacted Venango and Clarion counties in Pennsylvania. According to NOAA (2019), the Emlenton F0 tornado caused no fatalities, injuries or property damage. The tornado touched down south of Pine Grove in Venango County at 7:56 pm EDT and traveled east-southeast for five miles to lift north of Saint Petersburg at 8:03 pm EDT. The maximum width of the tornado was 300 yards.
Sources
E. W. Ferguson, F. P. Ostby & P. W. Leftwich (1987). The Tornado Season of 1985. Retrieved from: https://journals.ametsoc.org/doi/pdf/10.1175/1520-0493%281987%29115%3C1437%3ATTSO%3E2.0.CO%3B2
The Herald (2015). Few visible scars remain of that Friday night in 1985. Retrieved from: https://www.sharonherald.com/news/local_news/few-visible-scars-remain-of-that-friday-night-in/article_3943bf03-2677-51ba-a2eb-0e8547f9f494.html
NWS
Weather Prediction Center (2017). North American Surface Analysis:
Surface Analysis 12Z Friday May 31, 1985. Retrieved from: https://www.wpc.ncep.noaa.gov/html/sfc2.shtml
National Weather Service Cleveland, Ohio (2019). The Tornado Outbreak of May 31, 1985. Retrieved from: https://www.weather.gov/cle/event_19850531_85outbreak
National Weather Service Cleveland, Ohio (2019). May 31, 1985 Tornado Outbreak: 34th Anniversary. Retrieved from: https://www.weather.gov/ctp/TornadoOutbreak_May311985#Meteorology
M. Leduc, O. Jacobsen and B. Greer (Winter 1986). The “Black Friday” Tornado Outbreak in Ontario [PDF file]. Chinook, 8, 13-18. Retrieved from: cmosarchives.ca/Chinook/ch0801.pdf
NWS State College, Pennsylvania (2019). Corry, PA. Retrieved from: https://www.weather.gov/ctp/Corry
N. Sleptzoff & T. Dunkle (2009). 1985 Tornado Outbreak Revisited [PowerPoint presentation]. Retrieved from: https://www.weather.gov/media/cle/Wx_Events/85outbreak/1985%20Tornado%20Final%5B1%5D.pdf
NOAA National Centers for Environmental Information (2019). Storm Events Database. Retrieved from: https://www.ncdc.noaa.gov/stormevents/